My most respected financial blogger from outside Singapore.
He spoke for the first time recently and delivered a presentation listing all the important stuffs you have to know if you want to learn about the mindset on the path to financial independence.
It is a path less traveled, a path most of us don't know about (and stigmatized). We are brainwashed by massive consumerism nowadays, thinking that we always need to buy more stuffs, that we need to work for 40 years or more to reach retirement.
The fact is, most of us can achieve FI in much less time than most people think. And you don't even have to give up that much.
WDS 2016: Pete Adeney from Chris Guillebeau on Vimeo.
---------------------------------------------------------------------------------------------------------------------
This coincides with a recent post from AK's blog.
Do you believe you need to be a high-income earner to achieve FI?
The fact is it is not that tough for most people to do so - especially in Singapore, as long as you aren't in financial distress or extreme low income group.
Do you know nearly half the world population live on $2.50 a day?
(compare this to us spending $6 on a cup of coffee)
Do you know that a networth of about $70KUSD is enough to put you at the top 10% of the world's richest?
The fact is, most of us just don't want to put in the effort.
We save up for a year only to splurge it on expensive vacations (or worst, take a loan). If you live this way year after year, there's no way you can afford to stop working.
"Spend all the money we make, we will always be poor. Borrow money to fund our lifestyle, we will be poorer than poor".
Monday, January 16, 2017
Friday, January 6, 2017
Year In Review 2016 - Annual Financial Report
Presenting 2016 Annual Financial Report!
Note From CEO
It has been a year of ups and downs. We moved to a new revenue source (hopefully with better prospects), realized significant capital gains and held on through the unpredictability of the market.
Important highlights:
- We achieved record earnings, and our net asset value grew by over 33%.
- Our overall saving rate of the year stood at 78.2%.
- Our safety passive income now covers 28% of our expenses.
- Our XIRR for 2016 is 15.6%, the first positive year since inception.
- We generated over $3000 (approximately $250 per month) worth of dividends in 2016.
For more details, please refer to specific section of the report.
*All figures exclude CPF and investment capital gains/losses.
-------------------------------------------------------------------------------------------------------------------------
Comparison With Previous Year
Expenses overall was 16% higher compared to previous year, with the most significant expenses being:
- One Time Loss, Samsung Galaxy S7, Mayday Concert in Q2
- Parent Gift in Q3.
- Braun Shaver (9 Series) and Medical Consultation in Q4

Income was 14.1% higher than the previous year, arising from:
- Record bonus in Q1.
- Structural revamp (leave encashment and pro-rated bonus) in Q4.
- Overall higher income throughout the year.

-------------------------------------------------------------------------------------------------------------------------
Total Income VS Total Expenses
Expense were stable except for the month of May (one-time loss).
For the whole year, our expense as percentage of income stood at 21.8% (Comparable with 21.4% in 2015). In other words, we have a saving rate of about 78%.
We achieved a record operating income and hence profit for the year (highest ever), and we do not expect to duplicate this performance anytime soon (at least not for 2017).
-------------------------------------------------------------------------------------------------------------------------
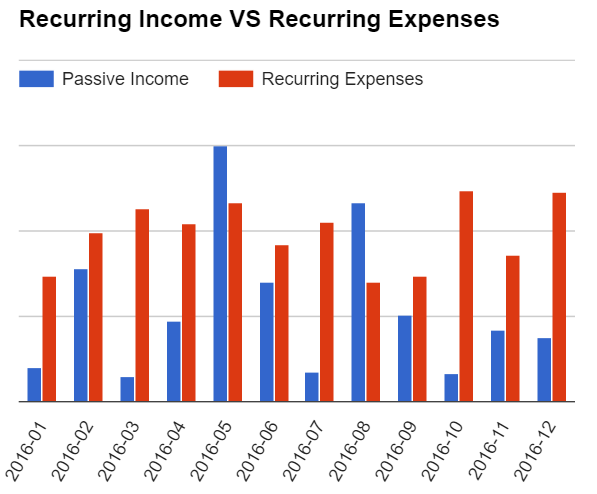
Passive Income VS Recurring Expenses
This section strips out the "noise" and highlight only the recurring portion of expenses against passive income.
It removes 3 main categories of expenses as compared to above:
1. Special - Major Items (mostly any non-essentials above $200, but not all), Gifts
2. Vacation - Any overseas trip
3. Tax - You do not get tax on capital gains/dividends in Singapore
It includes only the following form of income:
1. Dividends (Listed and Unlisted)
2. Regular Bank Interests (except special 1-time promotions)
And exudes all the following form of income:
1. Salary
2. Gambling
3. Angbao
4. Rebates - Any form of credit card or purchase rebates
5. Sale of any items
6. Rewards - Such as IPPT, RT payments, etc...
To be honest, I'm freaking amazed by the results. I'm doing much better than I imagined, and I would never have known if it weren't for all the effort put into tracking them.
There were 2 months (May and August, traditionally the 2 strongest dividend months) where my passive income exceeded my recurring expenses.
For Year 2016, my passive income is now sufficient to cover just over 56% of my recurring expenses (compared to 50% in 2015). Adding in the "double safety margin" criteria, it can cover 28% of my expenses.
-------------------------------------------------------------------------------------------------------------------------
Recurring Expenses Breakdown
As always, my top expenses are food, personal (clothing, self consumables), travel (transport) and utilities (internet and phone).
Some random discoveries:
1. I visited an "alcoholic outlet" and purchased a beverage only twice this year.
2. I brought 31 cups of Bubble Tea (i.e Koi, Gong Cha) 31 times this entire year, which costs me $106.50 in total.
3. I brought 23 cups of Cafe drinks (i.e Starbucks, Coffee Bean) this year, and each cup averages $4.80 (I usually only drink when there's 1 for 1 deal).
4. I ate fast food (counting lunch, dinner, supper) 81 times this year (!!!). To be frank, this figure is a bit higher than I thought and is not very healthy. Hopefully I can cut it down to perhaps 60 times or less.
5. I visited a restaurant 32 times this year (That's about 2 or 3 times a month, lower than most youngsters these day I believe). Each restaurant trip averaged $20.10.
6. I visited the KTV only 8 times (less than once a month) this year, each trip averaging $21. I should go to Neway more often.
 -------------------------------------------------------------------------------------------------------------------------
Our portfolio is up 18% while STI is up roughly 3.5%. Since IPO, our portfolio is at a breakeven status while STI is down about 8%.
A majority of our returns this year came from the privatization of China Merchant Pacific (CMP)/Super Group and sale of ST Engineering. On the other hand, we suffered the most losses from the "collapse" of M1 (with confirmation of 4th Telco).

In terms of acquisitions, we added Frasers Centrepoint Ltd in Q3 and Singapore Telecommunications in Q4 - both which are long-term dividend holdings we are very confident of.
For the entire year, the portfolio generated just over $3000 of dividends, $600 higher than last year (lower than expected). This was largely due to the events above: In exchange for capital gains, we lost the 2 dividend cash cows of CMP and ST Engineering (both listed and unlisted holdings).
As of now, we still hold the majority of our assets in Cash. Our equities portfolio remains healthy and diversified, with top holdings being FCL, FCT, Singtel and STI.
 -------------------------------------------------------------------------------------------------------------------------
Outlook For 2017
We will continue our strategy to build a sustainable and diversified dividend portfolio in 2017. With news of 3 rate hikes incoming, there will be plenty of opportunities to pick up bargains in the market.
As the company is holding a large proportion of cash, we intend to deploy them as soon as reasonable (projected 3 bullets in the first half of the year) to meet the dividend targets for next year.
Financial Goals For 2017
- Attain $5000 worth of dividends (depending on state of market)
- Increase STI as a core holding to 25% of our portfolio for stability and defensiveness.
- Explore other forms of investments (Robo) and perhaps Singapore Saving Bonds.
Note From CEO
Important highlights:
- We achieved record earnings, and our net asset value grew by over 33%.
- Our overall saving rate of the year stood at 78.2%.
- Our safety passive income now covers 28% of our expenses.
- Our XIRR for 2016 is 15.6%, the first positive year since inception.
- We generated over $3000 (approximately $250 per month) worth of dividends in 2016.
For more details, please refer to specific section of the report.
*All figures exclude CPF and investment capital gains/losses.
-------------------------------------------------------------------------------------------------------------------------
Comparison With Previous Year
Expenses overall was 16% higher compared to previous year, with the most significant expenses being:
- One Time Loss, Samsung Galaxy S7, Mayday Concert in Q2
- Parent Gift in Q3.
- Braun Shaver (9 Series) and Medical Consultation in Q4

Income was 14.1% higher than the previous year, arising from:
- Record bonus in Q1.
- Structural revamp (leave encashment and pro-rated bonus) in Q4.
- Overall higher income throughout the year.

-------------------------------------------------------------------------------------------------------------------------
Total Income VS Total Expenses
Expense were stable except for the month of May (one-time loss).
For the whole year, our expense as percentage of income stood at 21.8% (Comparable with 21.4% in 2015). In other words, we have a saving rate of about 78%.
We achieved a record operating income and hence profit for the year (highest ever), and we do not expect to duplicate this performance anytime soon (at least not for 2017).

-------------------------------------------------------------------------------------------------------------------------
Passive Income VS Recurring Expenses
This section strips out the "noise" and highlight only the recurring portion of expenses against passive income.
It removes 3 main categories of expenses as compared to above:
1. Special - Major Items (mostly any non-essentials above $200, but not all), Gifts
2. Vacation - Any overseas trip
3. Tax - You do not get tax on capital gains/dividends in Singapore
It includes only the following form of income:
1. Dividends (Listed and Unlisted)
2. Regular Bank Interests (except special 1-time promotions)
And exudes all the following form of income:
1. Salary
2. Gambling
3. Angbao
4. Rebates - Any form of credit card or purchase rebates
5. Sale of any items
6. Rewards - Such as IPPT, RT payments, etc...
To be honest, I'm freaking amazed by the results. I'm doing much better than I imagined, and I would never have known if it weren't for all the effort put into tracking them.
There were 2 months (May and August, traditionally the 2 strongest dividend months) where my passive income exceeded my recurring expenses.
For Year 2016, my passive income is now sufficient to cover just over 56% of my recurring expenses (compared to 50% in 2015). Adding in the "double safety margin" criteria, it can cover 28% of my expenses.

-------------------------------------------------------------------------------------------------------------------------
Recurring Expenses Breakdown
As always, my top expenses are food, personal (clothing, self consumables), travel (transport) and utilities (internet and phone).
Some random discoveries:
1. I visited an "alcoholic outlet" and purchased a beverage only twice this year.
2. I brought 31 cups of Bubble Tea (i.e Koi, Gong Cha) 31 times this entire year, which costs me $106.50 in total.
3. I brought 23 cups of Cafe drinks (i.e Starbucks, Coffee Bean) this year, and each cup averages $4.80 (I usually only drink when there's 1 for 1 deal).
4. I ate fast food (counting lunch, dinner, supper) 81 times this year (!!!). To be frank, this figure is a bit higher than I thought and is not very healthy. Hopefully I can cut it down to perhaps 60 times or less.
5. I visited a restaurant 32 times this year (That's about 2 or 3 times a month, lower than most youngsters these day I believe). Each restaurant trip averaged $20.10.
6. I visited the KTV only 8 times (less than once a month) this year, each trip averaging $21. I should go to Neway more often.

A majority of our returns this year came from the privatization of China Merchant Pacific (CMP)/Super Group and sale of ST Engineering. On the other hand, we suffered the most losses from the "collapse" of M1 (with confirmation of 4th Telco).

For the entire year, the portfolio generated just over $3000 of dividends, $600 higher than last year (lower than expected). This was largely due to the events above: In exchange for capital gains, we lost the 2 dividend cash cows of CMP and ST Engineering (both listed and unlisted holdings).
As of now, we still hold the majority of our assets in Cash. Our equities portfolio remains healthy and diversified, with top holdings being FCL, FCT, Singtel and STI.

Outlook For 2017
We will continue our strategy to build a sustainable and diversified dividend portfolio in 2017. With news of 3 rate hikes incoming, there will be plenty of opportunities to pick up bargains in the market.
As the company is holding a large proportion of cash, we intend to deploy them as soon as reasonable (projected 3 bullets in the first half of the year) to meet the dividend targets for next year.
Financial Goals For 2017
- Attain $5000 worth of dividends (depending on state of market)
- Increase STI as a core holding to 25% of our portfolio for stability and defensiveness.
- Explore other forms of investments (Robo) and perhaps Singapore Saving Bonds.
Tuesday, January 3, 2017
Letter To Shareholders (5) - Performance Review 2016Q4
Welcome to the 5th issue of ZZ Holdings Shareholders Letter.
Performance Highlights
Once again, Mr Market proves its unpredictability with the 'Trump Rally' after the US elections. After the rollcoaster ride, STI ended the year flat at 2.94, with dividends being the sole returns (about 3.5% depending on cost).
Our portfolio dipped slightly in Q4 but is still up over 18% for the year. After 2 years of investments, we are at an almost break-even point.
In the 4th quarter, we paid out dividends of nearly $400 (base on pay-date), comparable to the previous year.

Operating Highlights
Income for the quarter were roughly 30% higher compared to last year mainly due to 2 factors:
- Conversion of nearly 1 month of leave in November.
- Higher income and pro-rated bonus in December.
These retained earnings will offset the expected big drop in earnings in March (we expect around ~60% drop).

Expenses were about 25% higher compared to last year due to several major purchases:
- Wedding
- Western Digital HDD
- Braun 9 Series
Other notable expenses include farewell gifts, some pretty expensive games (civilization 6 and plague inc) and medical trips.
 Acquisitions
We added Singtel at $3.68 - a value we believe is quite fair and attractive. Singtel is a very diversified company (in terms of business areas and geographically) and derive the majority of its mobile revenue from overseas. The impact of the 4th Telco would hence be much lower.
We believe it would have no problem maintaining its 1.75c yearly dividend (20+ year track record, a mere ~60% payout ratio), representing a very stable and secure 4.8% yield.
Major Structural Change Complete
We are pleased to announce that smooth transition in the handing over.
There will be a one-time impact in March earnings next year, but we estimate comparable earnings for the whole year (depending on contract renewal). The change is definitely beneficial for the long-run.
Financial Status
1-Month SIBOR Rate is once again rising and currently stands at over 0.7%. Combined with Step-up interest, Maxigain now provides a risk-free interest of around 1.4%.
For now, we will keep a lookout for any Chinese New Year fixed deposit promotions in January, failing which we might transfer more funds into Maxigain.
We eagerly anticipate the launch of Smartly in 2017 (delayed numerous times), which is now believe to be in the final phases of approval.
Outlook
Performance Highlights
Once again, Mr Market proves its unpredictability with the 'Trump Rally' after the US elections. After the rollcoaster ride, STI ended the year flat at 2.94, with dividends being the sole returns (about 3.5% depending on cost).
Our portfolio dipped slightly in Q4 but is still up over 18% for the year. After 2 years of investments, we are at an almost break-even point.
In the 4th quarter, we paid out dividends of nearly $400 (base on pay-date), comparable to the previous year.

Operating Highlights
Income for the quarter were roughly 30% higher compared to last year mainly due to 2 factors:
- Conversion of nearly 1 month of leave in November.
- Higher income and pro-rated bonus in December.
These retained earnings will offset the expected big drop in earnings in March (we expect around ~60% drop).

Expenses were about 25% higher compared to last year due to several major purchases:
- Wedding
- Western Digital HDD
- Braun 9 Series
Other notable expenses include farewell gifts, some pretty expensive games (civilization 6 and plague inc) and medical trips.

We added Singtel at $3.68 - a value we believe is quite fair and attractive. Singtel is a very diversified company (in terms of business areas and geographically) and derive the majority of its mobile revenue from overseas. The impact of the 4th Telco would hence be much lower.
We believe it would have no problem maintaining its 1.75c yearly dividend (20+ year track record, a mere ~60% payout ratio), representing a very stable and secure 4.8% yield.
We are pleased to announce that smooth transition in the handing over.
There will be a one-time impact in March earnings next year, but we estimate comparable earnings for the whole year (depending on contract renewal). The change is definitely beneficial for the long-run.
Financial Status
1-Month SIBOR Rate is once again rising and currently stands at over 0.7%. Combined with Step-up interest, Maxigain now provides a risk-free interest of around 1.4%.
For now, we will keep a lookout for any Chinese New Year fixed deposit promotions in January, failing which we might transfer more funds into Maxigain.
We eagerly anticipate the launch of Smartly in 2017 (delayed numerous times), which is now believe to be in the final phases of approval.
Outlook
Details in the Annual Report.
Friday, December 30, 2016
My Acquisition Watchlist
FLT ($0.935) = Provide 0.65c DPU (very conservative estimates. Maiden results exceeded forecast) for ~7% yield. Long yield, strong management and low gearing at 28%. Good for 'pure exposure' to Australia and diverisfy away from SG. I will consider adding at $0.9.
Parkway Life REIT ($2.39) = Very defensive and stable with extremely strong financial ratios throughout. However, this comes at huge premium to NAV (1.5 times). Using a conservative 0.115 DPU, yield is only 4.8%, kinda low for a REIT. Will consider adding closer to $2.3 (5% yield)
Capitaland Mall Trust ($1.9) = Largest retail malls backed by Temasek. Latest quarter DPU dropped 6% (largely due to 1-time expenses), leading to annualized DPU of ~11c. Biggest AEI now is rebuilding of Funan (target complete 2019Q4), and lesser extent refurbishing of Raffles City. My biggest concern for retail is the impending arrival of Amazon and other online shopping mediums - hopefully the management has strategies to mitigate these risks. Assuming a DPU of 11c, yield is almost 5.8%. I believe it would be a good deal if I can catch it at about $1.84, below the NAV of $1.86 with a 6% yield.
Mapletree Commercial Trust ($1.42) - Vivocity (40%) and the recently acquired MBC I (~20%) are both extremely good assets, providing a good diversified income. NAV is $1.32, which does mean a slight premium at current price. I am fond of this REIT, but assuming even at the forecasted yield of 8.13c (post MBC acquisition), yield now is merely 5.7% - a bit too low for my taste. Downside could be limited due to preferential offering at $1.42 recently.
Starhill Global ($0.735) = This is a more 'concentrated' choice than Capitaland Mall with higher yield, as it derives near 70% of it revenue from 2 malls - Wisma Atria and Ngee Ann City (no doubt 2 very strong ones in the heart of Orchard). Gearing is at 35.1%. NAV 0.91. For this, I would like to use a more conservative 5c dividend going forward with no growth, translating to 6.8% yield. More than 7% yield (at $0.71) would be extremely tempting.
Starhub ($2.8) - How the great has fallen. Taking a very bad outlook of things (falling pay TV and 4th Telco) and assuming they cut dividends to 4c x 5 = 16c going forward, I would want at least 6% yield. This means closer to $2.6. This is on the basis that their fundamentals (mainly looking at their hubbing statistics) do not deteriorate further.
SPH REIT ($0.96) - Strong balance sheet with 26% gearing. Only 2 malls (Pentagon and Clementi Mall) This is my choice in between CMT and Starhill. Has ROFR on Seletar Mall as further growth. Full year DPU is 5.5c, translating to 5.7% yield. Would look into it should it fall closer to 80cents.
Thursday, November 10, 2016
Quarterly Results Review - 2016Q3
Frasers Centrepoint Trust (FY2016) | DPU: 11.764c NAV: $1.93 4th quarter DPU was 1.5% lower, mainly due to AEI at Northpoint. Full year DPU is 1.3% higher, marking its 10 year consecutive DPU growth. Financial sheet remains very healthy with ample debt headroom. Yield now around 5.8%. I remain very confident of FCT - Strong management records, potential accretive acquisitions from Waterway Point, new anchor tenants at CCP. They've also just acquired the retail podium of Yishun 10. The recent news of Amazon hitting Singapore early next year could put pressure on all retail REITs (and is dragging down its share price). I will look to accumulate should it should fall to $1.8 (around 6.5% yield) |
Super Group (FY2016Q3) | Awaiting takeover at $1.3 |
Sembcorp Industries (FY2016Q3) | 9M results: Utilities begin to show results, with net profit up 11% excluding 1 time items. More overseas (india and China) plants expected to commence in 4Q. Marine profits plunged 82%. Disastrous, but still profit-making I guess. Overall, 9M Net profit plunged 49% to 12.2 cents. Assuming an annualized EPS I was expecting an annualized EPS of 19 cents, but it looks like it could hit as low as 16 cents now. At 16 cents EPS and 10 cents DPS at $2.5, it's P/E is 15.6 and yield is 4%. NAV is $3.58. Free cash flow was a huge positive due to capex cuts. I am most worried about its debt (interest cover at merely 3.4) |
M1 (FY2016Q3) | Revenue fell 10% and 3Q net profit falls 23.4% - a surprisingly bad result. And the 4th Telco isn't even online yet! Market share and everything else remained stable. The introduction of add-on data (to deter the 4th Telco) have reduced their data revenue significantly IMO. Debt keeps climbing higher, with Debt/Equity now at 1.1 from 0.9 last year. Management guided ~12% decline in profit from 'single digit decline' previously. 9 Months EPS is 12.6. Assuming 15cs full year EPS and 80% payout ratio of 12c DPS at $2.1, P/E is 13 and yield is 5.8%. |
Capital Commercial Trust (FY2016Q3) | Continue to hold up well with ever so slightly growing DPU. AEI includes Raffles City refurbishing and redevelopment of Gold Shoe Car Park. I am expecitng at least 8.5c (in the worst case) to 9.0c DPU for a long time. At $1.5, this is yielding 6%. |
Accordia Golf Trust (FY2016Q2) | DPU came in about 5% lower compared to last year, attributed to higher than usual occurence of typhoons in Aug and Sep. Visitors and utilization all went lower as a result. Half year DPS is 2.45c (down from 2.58c). Overall, nothing to be concern about if we believe that the DPU will remain "stable over the long term". Assuming a conservative 4.8c annual dividend, yield is around 7.4% (I am not hopeful of 9.6% present in the slides) |
ST Engineering (FY2016Q3) | Results is not that bad despite the headlines fell in net profits due to 1 off $61M provision. Management guided comparable revenue and lower PBT compared to last year. Expect 15c dividends to be very safe based on strong order books, track records and cashpile. Will look to add this should it hit $3. (5% yield) |
Straits Times Index (FY2016) | Not Applicable |
Friday, October 7, 2016
Letter To Shareholders (4) - Performance Review 2016Q3
Welcome to the 4th issue of ZZ Holdings Shareholders Letter.
Performance Highlights
Global markets continue to be volatile, led by interest rates concerns, upcoming US elections and fears on the health of Deutsche Bank.
Locally, STI is flat - gaining a mere 1% quarter on quarter and year to date. The likely entry of the 4th Telco and non-performing loans of O&G seems to be exerting its pressure on the STI (roughly 40% made up by Singtel & 3 Banks).
Our portfolio performed slightly better, gaining 1.5% quarter on quarter, and roughly 12% year to date. We are now roughly break-even since IPO (on 1st Jan 2015).
In 3rd quarter, we paid out dividends of over $800. This is over 50% more compared to $500 last year. We will continue to build up recurring income, brick by brick, little by little.

Operating Highlights
Income for the quarter were up around 8% mainly due to increased revenue and dividends. Actual percentage were lower due to the absence of the one-time SG50 bonus in July 2015.

Expenses were much higher largely due to re-contracting and signing of Samsung Galaxy S7 in July, and gift expense to our parent company in August.
Accounting changes took place which affected the expenses for August - The company decides to perform monthly deduction of income tax instead of one-time lump sum deduction in August 2015.
The main reason is to set it in line with the actual cashflow expenses, and spread out this expense over the year instead of misleadingly inflating August expense. This mean that every month expense will be slightly higher compared to Year 2015 from this quarter onwards.
Note: The income tax for a specific year starts in May and ends in April. For example. The income tax for year 2015 is paid from May 2016 to April 2017.
For the 4th quarter, we forsee higher expenses due to higher social and entertainment activities, as well as costs related to the structural revamp.

Investment - Frasers Centrepoint (FCL)
FCL is one of the largest real estate company on SGX with business units focusing mainly in Singapore & Australia, spreading across the entire chain of residential, commercial, hospitality and industrial properties. It hold stakes in 4 of the Frasers REITs, and as of 9M2016, derives around 70% of its profits from recurring income. This makes it ideal as a dividend and growth play (30% property development).
At $1.48, it trades at more than 30% discount to its book value of $2.19. 9M2016 EPS is 11.9 cents. Annualized conservatively, we expect EPS to be at least 15 cents.
FCL dividend policy is to distribute up to 75% (although usually around 50-60%) of its core earnings, which is in line with 0.86 cents in the past 2 years. Assuming it is able to retain its dividend, this presents a yield of around 5.8%.
Key risk include interest rates hikes as FCL is considered to be quite highly geared (interest cover of 6 and gearing of 0.7). At current valuation, we feel that there is sufficient margin of safety and see it as a good value play. Given its diversified investments, we see this as a mini "Property ETF" that we can hold indefinitely.
Major Structural Change
The company will be undergoing a major structural change in Nov. Revenue in Oct will be slightly affected, and Nov to be majorly (~90%) affected. A one-time asset (leave encash) sale is expected to help offset this revenue loss.
Thereafter, revenue should resume in December and see positive progression in the long term.
Financial Status
We intend to open a Bank of China (BOC) SmartSaver account - designed to takeover OCBC360. This is expected to increase our standard interest rates from 1.75% to 2%, and possibly 3.55% should we meet the required conditions.
[Afternote: After trying out BOC, we were hit with a few major pain points. The internet banking is bad and lack of mobile banking, no e-statements. For the meantime, we feel that the additional admin work is not worth it.]
Maxigain bonus interest is now 0.6%, and should exceed CIMB Fastsaver regardless of the SIBOR soon.
As per last quarter, we continue to anticipate the following services and events in the last quarter of 2016:
1. Smartly, a robo-financial advisor who is gearing for launch.
2. 8 Securities, a potential alternative for much lower brokerage fees.
3. Singapore first ETF REIT
Outlook
With the hot-dividend period winding down, our focus now shifts to preparation for Year 2017. We will start accumulating positions in high dividend investment for the long term with the objective of taking a great leap in dividends amount. This will be further detailed and set in the Annual Report.
Monday, September 19, 2016
Quarterly Results Review - 2016Q2
| Frasers Centrepoint Trust (FY2016Q2) | DPU in previous vs current: $0.116 - > $0.120 Price in previous vs current: $2.00 -> $2.17 Yield in previous vs current: 5.8% -> 5.5% BV in previous vs current: $1.91-> $1.90 Revenue dipped as expected due to Northpoint AEI. Income was stable due to retained distributions from previous quarter, and higher management fee in units. Debt remains healthy. |
| Super Group (FY2016Q2) | EPS in previous vs current: $0.0424 EPS in previous Q2 vs current: $0.094 -> 0.088 DPU in previous vs current: $0.010 -> $0.010 Price in previous vs current: $0.90 -> $0.78 Tolerable results with profits dropping "just" 7%. The reasons for holding remains the same as before - strong operating cash flow (and FCF) and balance sheet with good margins. I am estimating 4 cents earning for the year. No turnaround in sight so this will be in the freezer for a while. |
| Sembcorp Industries (FY20161H) | EPS in previous 1H vs current: $0.20 -> $0.97 DPU in previous 1H vs current: $0.05 -> $0.04 Price in previous vs current: $2.7 -> $2.8 Yield in previous vs current: 4.0% -> 2.8% BV in previous vs current: $3.6 -> $3.6 (~$3.3 excl. pref shares) Surprising hit on Utilities segment, although I am still confident in the long-term fundamentals of India. Marine as expected post disastrous results. Assuming an annualized EPS of 19cents, P/E at current price is 14.7. |
| M1 (FY2016Q2) | EPS in 2014 vs 2015: $0.191 -> $0.191 EPS in previous 1H vs current: $0.096 -> $0.089 DPU in previous vs current: $0.153 -> $0.153 Price in previous vs current: $2.48 -> $2.78 Yield in previous vs current: 6.2% -> 5.5% Management guided single digit decline in profit. Not good at all. Interim dividends of 7c is maintained. They are investing in new technologies but it will take the longer term to see any payoff. |
| Capital Commercial Trust (FY2016Q2) | DPU in 2014 vs 2015: $0.086 -> $0.086 DPU in previous Q2 vs current: $0.0219 -> $0.0220 Price in previous vs current: $1.4 -> $1.55 Yield in previous vs current: 6.1% -> 5.5% BV in previous vs current: $1.72 -> $1.72 Flat results and DPU should be maintained. I don't see any upsides or downsides now, and at this price it's probably fully valued. |
| Accordia Golf Trust (FY2016Q1) | DPU in previous Q1 vs current: $0.00176 -> $0.0182 (12M: $0.0663) Price in previous vs current: $0.65 -> $0.68 Yield in previous vs current: ~10% BV in previous vs current: $0.89 -> $0.96 Slight decrease in operating income (2.3%) due to heavy rains and earthquake, but DPU increased slightly due to Yen appreciation. Profits after tax is 6% lower. No of visitors and utilization rate went slightly lower due to above reasons, but should not pose too much concern. This is still trading at a huge discount to NAV which is my safety net. My yield cow for the long term. |
| ST Engineering (FY2016Q2) | Flattish results but management foresee lower profits compared to 2015. This is in contrast with the "comparable profits" guidance given earlier, leading to selldown in share price. |
| Straits Times Index (FY2016) | Not Applicable |
Subscribe to:
Posts (Atom)