Key Highlights & Notes From CEO
"常将有日思无日,莫待无时想有时"
We never once took our main income as being secured or guaranteed, and the long-term future have always been on our mind. Every day, we build our portfolio bit by bit, brick by brick, for the ultimate goal of escaping the rat race in the not so distant future.
This has been a smooth-riding year as we completed 1st year in our new job, ride on the strong bull market and took a giant step towards our FIRE goal. Our financial balance sheet has never been stronger.
Our Achievements (2017)
1. Record earnings since inception - net asset value grew by 29% (33% last year).
2. Highest overall saving rate in history - 80.5% (78.2% last year).
3. Safety passive income (2x expenses) now cover 41% of our recurring expenses (28% last year).
4. Portfolio market value grew by a staggering 72% (inclusive of capital injection and gains).
5. Portfolio XIRR for 2017 is 20.44%, up from 15.6% last year.
6. By pay-date, distributed over $4300 (~$360 per month) worth of dividends ($3000 last year).

Our Balance Sheet (2017)
- More than 5 years expenses* worth of Emergency Funds
- More than 5 years expenses* worth of Warchest
- "Working capital" of 4 bullet rounds, ready to be fired in 2018
- Max out $40,000 in CPF-SA for the additional interest (5% interest for first $40K)
*Based on our highest expenditure year thus far.
Even if we were to lose our job today, I am very confident we can live a relatively comfortable life for at least the next 15 years. The problem - 15 is far from enough.
Comparison With Previous Year
Income was about 3.7% higher due to slightly higher active and passive income. We actually achieved a higher operating income this year despite the record breaking 2016 (a big surprise).

*All figures exclude CPF and investment capital gains/losses.
-------------------------------------------------------------------------------------------------------------------------Saving Rate For 2017
Expense were stable except for the month of August and November (you can see clearly the spike caused by our big angbao and new laptop).
For the whole year, our expense as percentage of income stood at 19.5% (21.8% in 2016, 21.4% in 2015), translating to a crazy saving rate of 80.5%! This is skewed by a relatively low expense year, so it might be some time before we see such rate again.
As a percentage of our active income, we saved 89.5% of our salary!

-------------------------------------------------------------------------------------------------------------------------
Recurring Expenses Breakdown
After recording expenses for 3 years, many things are becoming more apparant as I now have a good base to see trends and make comparisons. This year would be considered "average" as I spend somewhere between 2015 and 2016.
I do see "one-time"expenses rising over time as I intend to give more to my parents every year. Recurring expenses should be stable at around 60 to 70% of total expenses.

Overall categorical expenditures are identical with last year - except that I spent much less on personal and entertainment this year. Top categories are the essentials - food, travel (transport) and utilities (internet and phone).
Random discovery time!
1. My lottery spending (Toto, 4D, Big Sweep) this year is $300, about $25 per month. I strucked Group 5 once and Group 6 a couple of times, earning back $80. There goes $200+ donation to Singapore Pools.
2. I ate fast food 68 times this year (counting lunch, dinner, supper)! I set a goal of 60 last year which I didn't meet, but it's still an improvement over 81 times last year.
3. I brought only 11 cups of Bubble Tea (i.e Koi, Gong Cha) this entire year, which costs me only $34 in total (Praised the $2 Liho promotions!). This was much better than 31 last year.
4. I brought 15 cups of Cafe drinks (i.e Starbucks, Coffee Bean) this year, totaling $63. Accounting the treats from others, it should be around 21 like last year.
5. I visited a restaurant only 20 times this year with each trip averaging $14.80. The low costs was largely due to subsidies like the NS50 vouchers.
6. I wenting singing in Singapore only 4 times this year (down from 8), each trip averaging $16.50. Anyone want go sing? :(
8. I earned over $400 from MINDEF this year (10 ICT Sessions and IPPT-Pass)! I am strongly motivated not to go for IPT again, which unfortunately (fortunately) means $200 lesser next year.
This section strips out the "noise" and highlight only the recurring portion of expenses against passive income.
Year 2017, passive income is now sufficient to cover 82% of my recurring expenses (56% in 2016). Adding in the "double safety margin" criteria, it can cover 41% of my expenses. Once again, this is skewed by the low expense year.

Glad to know that our time-weighted returns have beat the index every year except in 2014 when we first dipped into investing. I also think we achieved this on comparable volatility to the STI.
| Year | Portfolio | ES3 |
|---|---|---|
| 2014 | -2.94% | 7.00% |
| 2015 | -8.12% | -10.64% |
| 2016 | 11.92% | 2.73% |
| 2017 | 22.00% | 21.11% |
| Overall | 21.76% | 18.95% |
| Year | Portfolio | ES3 |
|---|---|---|
| 2014 | 15.79% | 2.68% |
| 2015 | 3.65% | 3.41% |
| 2016 | 3.60% | 4.03% |
| 2017 | 1.77% | 2.46% |
| Overall | 7.49% | 3.24% |
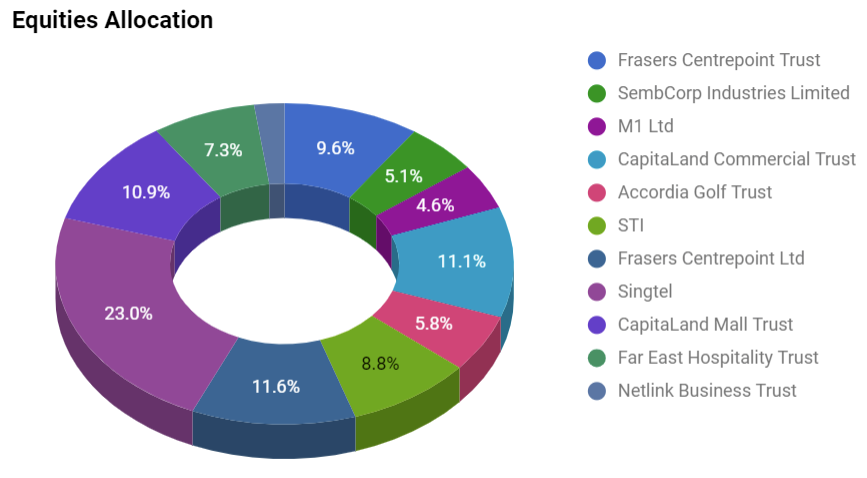
In terms of acquisitions, we added CapitaMall Trust, Far East Hospitality Trust, Singtel as well as a small stake in Netlink Business Trust. A majority of our returns this year came from the recovery of multiple REITS, especially CCT which continue to run despite the rights issue. The major loss came from the privataization of Super Group, which locked in 25% (about $1800) loss.
Our major holdings currently are Singtel (23%), the Capitaland REITs and the Frasers Family. Excluding the STI, we have a healthy and diversified portfolio of 10 holdings (up from 8 last year).
Compared with last year, we have grown the size of our portfolio by a staggering 72%!
Review of 2017 Goals
We fell short of the $5000 dividends/STI goal due to the bull market, and stop pursuing the Robo-investment strategy in consideration of the high management fees.
Outlook For 2018
2018 strategy remain pretty much the same as before - continue to build a strong and diversified income portfolio. This time round, the markets are much higher than before and we have to be extra caution in case the black swan arrives.
Our ammunition have replenished entirely after December, and we intend to deploy them before the dividends season come in Q2. The major goal next year would be $6000 worth of dividends ($500/month!) - it's tough and we really need to see some great singapore sales to achieve this. SGXCafe projection currently is around $5300.
Next year main revenue would depend largely on whether our contract gets renew in Q4. If so, income should be slightly higher.
Given that we have replaced our phone in 2016 and brought a new laptop in 2017, we do not forsee any major expenses. There is a slight possibility (5%) of wanting to upgrade our PC if it completely breaks. There are plans currently to travel to nearby region in Q1, but it is not anything too lavish.
All in all, I expect next year expenses to be around +10% (mostly from increased angbao for parents) compare to this year. Let's see.
Long Term Goals
With 3 years of cashflow records, we can finally map a high level financial roadmap for the next 10 years. These are very rough estimates (guidelines), but I think they are something to look forward to:
By 2020, passive income should be able to pretty much cover all recurring expenses. By ~2022, we should be able to save 100% of our salary every month.
In Year 2022, we would also become eligible to buy a HDB flat - it will be a huge decision that we have to make when the time comes.
Before 2025, we should reach our "safety passive income" goal of covering our recurring expenses twice over.
All these are assuming that current circumstances remain unchanged (no marriage, no unexpected emergencies, catastrophic economic crisis, etc).
No comments:
Post a Comment